
EN - Impact Update Google 2020/12/03
Analysis done according to the websites evolutions on a period of 30 days (from 10 Novembre to the 10 December), using ahrefs datas (positions, audience) from every countries, every languages.

Correlation between On Site datas and the Update
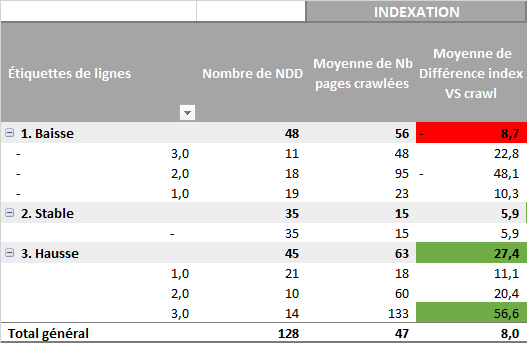
INDEXATION
We observe a real correlation between :
- the number of pages indexed by google compared to the url accessible by crawling the website
- the evolution of website positions on the selected period.
- Thus, sites with more pages crawled than indexed have lost positions whereas site with more indexed pages than crawled have won positions.
- For exemple, steelbet.ru has112 indexed pages for 1077 HTML pages accessibles by crawling the website, and has suffered a level 2 decrease.
- Conversely, viche.info has 670 indexed pages for 37 HTML pages accessibles by crawling the site, and has benefited from an level 3 increased
- It is therefore important to ensure good pages indexation, sites with bad indexation having suffered more.
- In general, we see that the network has a problem of internal links, because normally we should have the same amount of indexed pages and crawled pages. Orphan pages ? Forbidden pages indexed ?
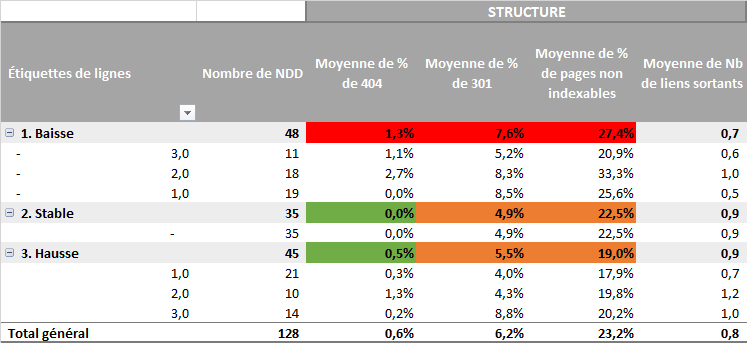
STRUCTURE
- We observe a important correlation between the amount of non-indexable pages present into the internal meshing and the evolution of the visibility of the sites after the update.
- Thus, the more sites have pages responding in 404, 301 or simply not indexable (pages in noindex, canonized pages, pages blocked by robots.txt and pages not responding in 200 in general) in their internal mesh, the more important the decrease is.
- The 48 sites that declined had an average of 27% non-indexable pages compared to only 19% for the 45 sites that increased.
- As was already the case for the May 2020 update, this new update seems to affect pages with internal meshing issues.
- It is therefore necessary to make sure to have a minimum of pages that are not indexable and do not respond in 200. The perfect SEO site should have 100% of the links to pages with 200 response code.
- Globally on the network we note a significant proportion of pages present in the internal mesh are not indexable (23%), so it will be necessary to work on the structure of the sites to ensure the relevance of all the pages present.
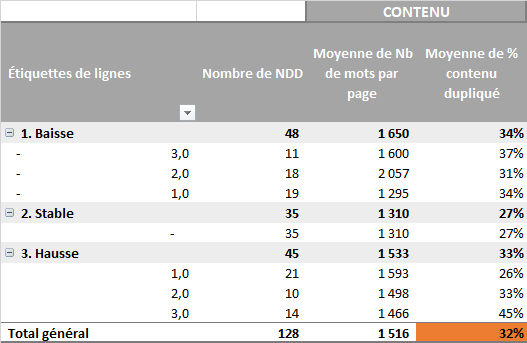
CONTENU
- On this update, there does not seem to be any particular correlation between the content data (number of words per page / the percentage of duplicate content).
- Nevertheless, a significant percentage of duplication can be observed across the whole network, with an average of 32%. We will have to work on lowering this ratio, either by adding unique content, or by merging pages that are too close semantically.
Correlation between Off-site data and the Update
No data, during an analysis based on our first index, appeared on the off-site side. (Reminder: this index is based on the global evolution of the positioning on ahrefs).
So we decided to create another index, based on the average position of sites on the keywords we track in the NSN tool.
Taux d'ancres des liens
Anchor rates follow a triangular distribution. On average, 13.3% of anchors are found on the sites that had the largest falls, 12.8% on the sites that had the largest increases. The closer to 7.6%, the more stable the positioning.
It can also be seen that the average number of optimized anchors for sites on the rise (whatever the increase) is regular, close to 10%.
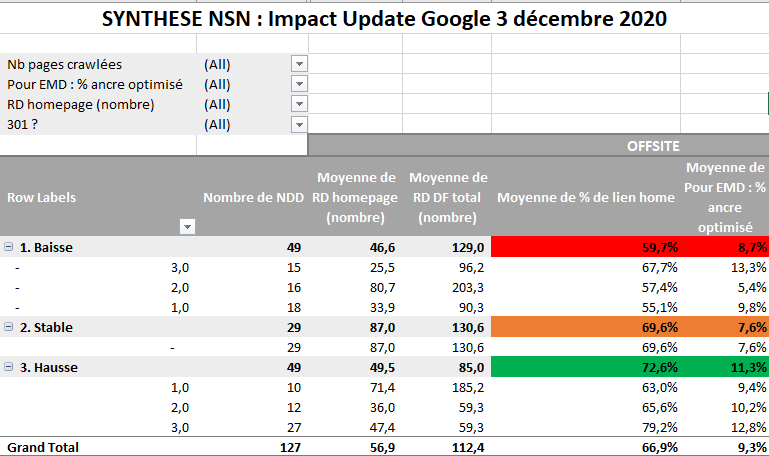
Distribution of backlinks
It appears that the sites with the least RD (85 on average) and with a higher percentage of links to the home page (72.6%) are those that have had the best results during the update.
Conversely, sites with a lot of links (129) but a lower distribution of links to the home page (59.7%) had the worst results.
We then took out from our datas sites that receive 301.
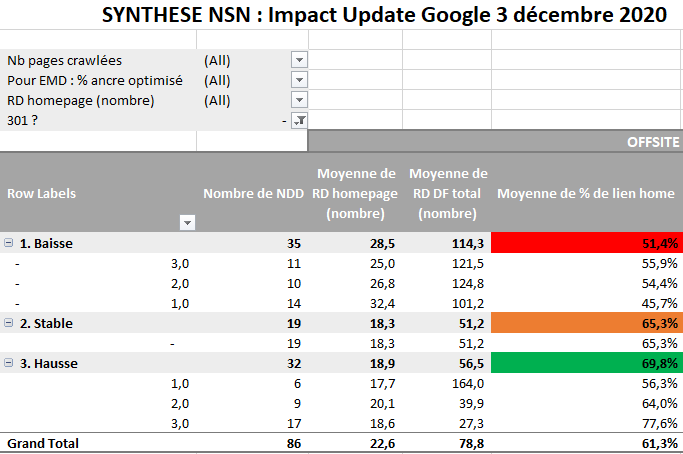
Here, too, the observation is striking:
35 sites with an average of 114 RD and 51% links to the home page : fall on targeted keywords.
32 Sites with an average of 56 RD and 70% links to the home page : improved results.
Moreover, 17 out of these 32 sites have known a strong increase, and have an average of 77.6% of links to their homepage.
Off site : Conclusion
It appears that the number of links made to the home page is a direct criterion of evolution during the previous update. The fall can be interpreted in two ways:
- Too many backlinks are made to internal pages,
- The homepages do not receive enough links.
We avoid drawing conclusions about anchor rates.
The way data is collected and stacked (only homepages, taking into account only the most used anchor), the differences in structure between sites (EMD, EMD now premium, Premium that target 'promo codes' on homepages), mean that our data is not sufficiently accurate.
We can still imagine that the "rule" of the 10% optimized anchors still seems to be valid, according to the data in the table.
What to do ?
It is important to remember that here, we only have data related to the impact of the update, and not on the overall health of the websites.
What did we learn during this update analysis? Essentially that the best practices of on-site SEO and the natural aspect of netlinking must be at the center of our actions.
For sites penalized on December 3rd
- Define which sites should be kept
- Internal mesh cleaning: Removal of 404 and 301
- Removal of non-indexable pages (beware of outgoing links)
- Netlinking: Links to homepages on non-optimized/natural anchors
Pour les sites non pénalisés en cours de développement
- Audit technique et mise en place des préconisations on-site pour démarrer tous les sites sur une structure propre
- Conserver des stratégies de liens avec 70% des backlinks en homepage sur des ancres naturelles
- Faire attention à l'optimisation des ancres des sites internet : 10% maximum
- Audit sémantique : faire un état des lieux de l'optimisation des contenus et du maillage interne
For the non-penalized sites on which we work
- Technical audit and implementation of on-site recommendations to start all sites with a clean structure.
- Maintain link strategies with 70% of homepage backlinks on natural anchors
- Pay attention to the optimization of website anchors: 10% maximum, after creating a sufficient amount of non-optimized backlinks,
- Semantic audit: to make an inventory of the state of play of content optimization and internal networking